UNOS data analytics
Performance improvement data tools
Benchmark against other transplant hospitals
Transplant Benchmark Report
Broaden organ acceptance and increase transplants
CARE tool
Monitor and benchmark activity and outcomes
Transplant Program Dashboard
Forecast trends in key outcome metrics
UNOS Predict
Monitor key indicators of program activity
Key Insights Dashboard
Powerful staffing benchmarks
UNOS Staffing Survey
Submit multiple payor forms with a single RFI
UNOS RFI
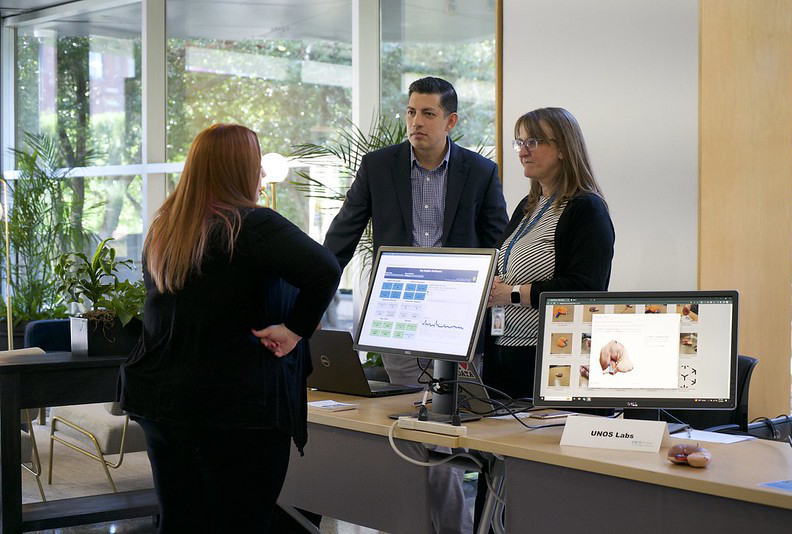
Unlock insights with UNOS tools
A powerful suite of data and research analytics services, the UNOS tools help transplant programs improve patient outcomes, stay ahead of regulatory requirements, and drive quality and performance improvement initiatives.
Transplant Benchmark Report
Compare. Understand. Improve.
Benchmark your data against other programs

UNOS Transplant Benchmark Report
Released quarterly
Standard report
UNOS provides transplant hospitals with quarterly Benchmark Reports, offering insights into patient populations, listing practices, and transplant activity. Compare your data regionally, nationally, and with similarly sized programs.
Branded report
Complete your report with a custom look—include your corporate logos and colors in addition to the standard UNOS branding. The result? A professional-looking document perfect for executive presentations.
How do I request a branded report?Request these customizations in UNet℠, along with the other new analytical offerings for UNOS member transplant hospitals. Submit the UNOS Analytics Service Request form by using 'add a new request' on Secure Enterprise landing page.
Customized report
Enhance your report with even more custom options.
More customizations are coming—let us know your ideas.
Current customization options
- Standard reports come with:
- Customizable comparison groups
- Select two other programs as added comparison groups within your waitlist and transplant chapters
- Benchmark figure image files
- Easily incorporate these graphics into your presentations
- Customizable comparison groups
- Each transplant program can select one of the following add to their standard report:
- One-year patient and graft survival
- 6-month and one-year follow-up form data
- Donor offer acceptance rates
- Waitlist volume trends
Care Tool
Learn what happened to the organs you turned down

UNOS CARE tool
Updated weekly
Understand your organ acceptance behavior
Identify opportunities to increase organ acceptance without negatively impacting outcomes that save more lives.
Get specific
- Visualize your organ acceptance for specific types of donors to transplant more organs
- Learn what happened to the organs you turned down – get transplant-specific and aggregate outcomes
- See maps to understand where your organs are coming from
Transplant Program Dashboard
Monitor and benchmark activity and performance
Track pre and post-transplant patient metrics

UNOS Transplant Program Dashboard
Updated monthly
Personalized interactive dashboard
This tool allows you to select specific transplant hospitals as your benchmarks. Get insights into:
- Waiting list additions by various candidate characteristics
- Current waiting list demographics (diagnosis, active/inactive, medical urgency, etc.)
- Waiting list outcomes (transplant and mortality rates)
- Transplant activity including recipient demographics and donor characteristics
- Understand your post-transplant outcomes including causes of death/failure, length of stay, and evaluation of graft outcomes
- Understand where patients from each state are being transplanted
UNOS Predict
Forecast program trends and take action
Know where you stand ahead of the PSRs

UNOS Predict
Updated monthly
Get specific
- Users can customize the dashboard using filter selections for organ types, outcomes, donor type, and age groups
- The dashboard displays observed and expected rates, hazard ratios, and red and yellow zone thresholds for performance monitoring
Track and predict program trends
- Monitor the current state of your risk-adjusted outcomes for future program-specific report (PSR) cohorts
- Use these trends to implement improvement plans in advance of future PSRs and avoid getting flagged by the MPSC
As close to real time as possible
- Data points captured and publicly released by SRTR tell the data story retroactively
- UNOS Predict provides data closer to real time, allowing your program to make improvements and course correct before it’s too late
What metrics are available today?
- 90-day graft survival
- 1-year conditional on 90-days graft survival
- 1-year graft survival
- Pre-transplant mortality
Offer acceptance data coming in 2025.
Key Insights Dashboard
Key indicators. At-a-glace understanding.
Executive level pulse check for your program

UNOS Key Insights Dashboard
Updated weekly
Big picture
Displays 24 high-level indicators selected by a working group of your peers. Indicators are updated annually to stay on top of trends.
Make data-supported decisions
Quickly check trends for important measures:
- Waitlist additions
- Waitlist management
- Transplants performed
- Donor characteristics
- Organ offers
- Outcomes
Staffing Survey
Leverage the power of your most valuable asset-your staff.
Developed by and for Transplant Administrators

Staffing Survey
Conducted anually
Gain essential insights by participating
- View summary and comparison staffing data from other programs to assist with your planning and hiring strategies
- Understand staffing trends and strategies by reviewing aggregate data
- Analyze results via a dashboard or export data for easy reporting
UNOS RFI
Payor forms simplified.
Never miss a deadline.

UNOS RFI
Released anually
Streamlined experience
Share your information with multiple payors through a single data collection tool.
- Information from previous year’s submission comes pre-filled
- Accessible directly through Secure Enterprise
- Filter forms by progress status
UNOS custom solutions
Innovation for your data needs
Have a research or data need not covered by these tools? UNOS research experts can consult with you to solve for your unique need.
Custom registries and databases
Insights on patient population trends or improved outcome measures. Learn more.
Technology consulting
Statistical modeling and research experts for domestic or international development of optimal solutions.