in focus
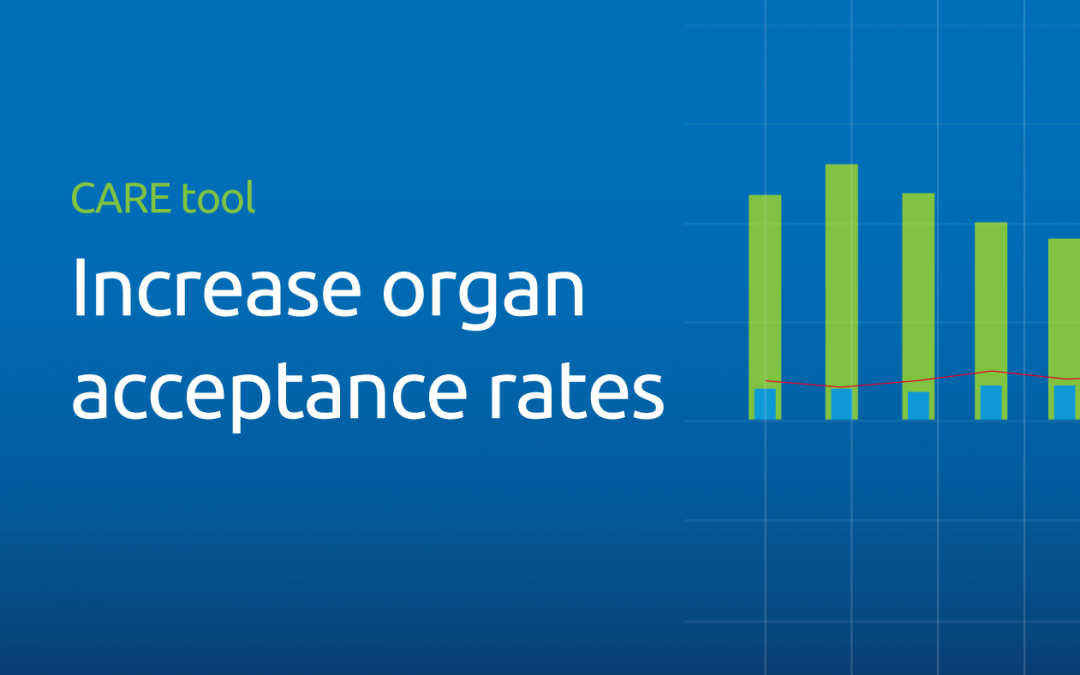
The Accept visualization allows user to see trends over time by day, month, quarter, or calendar year.
Using the Center Acceptance and Refusal Evaluation (CARE) tool, transplant centers can see all of the outcomes for organ offers they accept as well as all of those they refuse.
This interactive tool allows transplant centers to review their own organ acceptance rates for specific types of donors, along with transplant specific and aggregate outcomes information on the organs they refused that were transplanted elsewhere.
“The CARE tool offers instantaneous visualization of transplant centers’ organ utilization,” says Scott LeHew, Business Development Manager, UNOS Solutions, “and a better understanding of the decisions they’re making regarding organ refusal and acceptance.”
Updated monthly, the tool includes information on all organs (other than VCA) offered to the center during the most recent two-year period available. The data are divided into two separate reports by organ type—thoracic, which includes data on offers to heart, lung, and heart-lung patients, and abdominal, which includes data on offers to kidney, pancreas, kidney-pancreas, liver, and intestine patients.
The report features at least three separate visualizations for each organ type: Accept, Offers, and Survival.
For kidney and kidney-pancreas offers, a fourth visualization is provided to review the rate of delayed graft function of organs accepted by the center as compared to those refused and transplanted elsewhere.
ACCEPT
The Accept visualization allows the user to view the number and percentage of organs (donors for kidneys, lungs, and split livers) offered and accepted by the center during the two-year period. Only those offers where the center had the opportunity to accept the organ (i.e. the center had at least one “primary” offer and their first candidate was above the last acceptor on the match run) are included in the calculation of these rates.
These data can be filtered by a variety of different match, donor, and organ characteristics, including Recovery OPO and Distance to Donor Hospital.
OFFERS
The Offers visualization provides the user with a detailed listing of all the offers that were displayed in aggregate on the Accept page.
These data can be filtered by a variety of different match, donor, and organ characteristics similar to Accept reports with some additional filters, including Primary Refusal Code if users only want to review refusals for Donor Age/Quality, or Patient ID/Unavailable.
SURVIVAL
The Survival visualization provides aggregate Kaplan-Meier graft and patient survival rates at six months and one year post-transplant. It compares organs the center transplanted with those the center was able to accept for at least one candidate and were ultimately transplanted at another U.S. transplant center.
Filters for this visualization are specific to the applicable donor characteristics of the organ type analyzed. For all organ types, filters include Declined for Donor Related Reasons and Survival Types, which allow the user to toggle between patient and graft survival rates.
DGF
This visualization is only available for kidney and kidney-pancreas transplant. Similar to the Survival visualization, this piece of the tool allows the user to compare the Delayed Graft Function Rate (defined as need for dialysis within first week post transplant, collected on Transplant Recipient Registration form) for those organs they transplanted with the organs they refused for at least one candidate at their center and were ultimately transplanted at another U.S. center. The filters available are similar to those in the Accept and Offer visualizations for the same organ types.
Learn more about custom data solutions offered by UNOS.
In focus
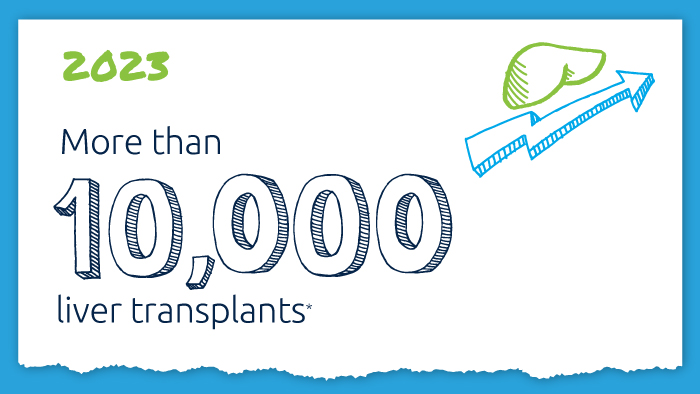
A decade of record increases in liver transplant
10,660 liver transplants, the most ever in a year.
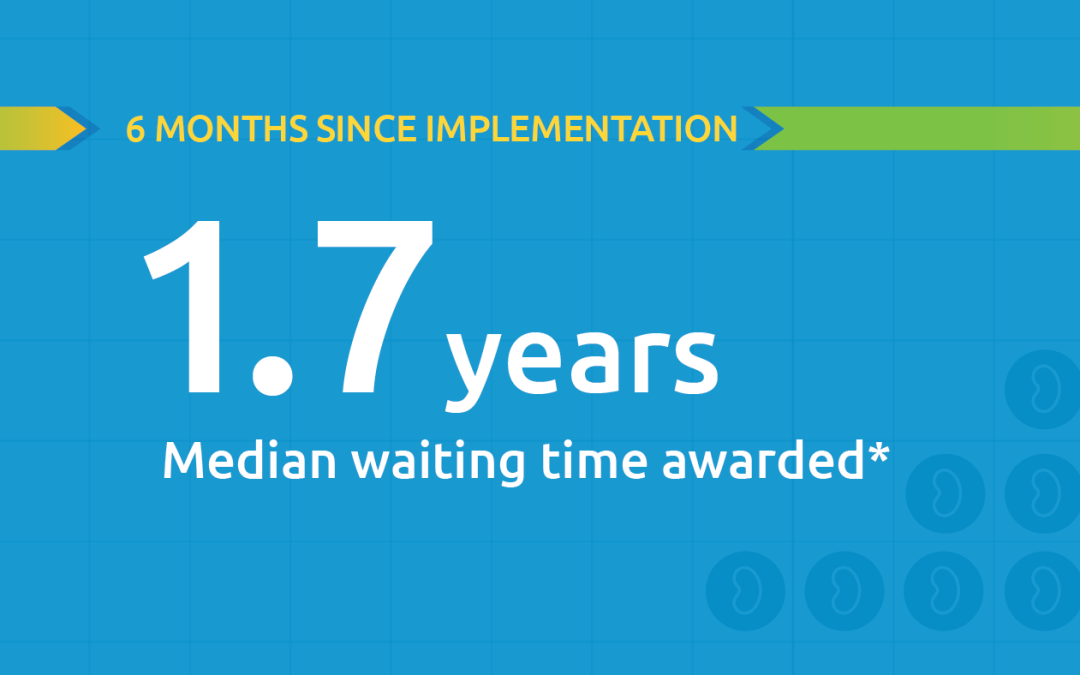
Black kidney candidates are receiving waiting time modifications, helping them get the organs they need
Latest kidney monitoring report shows two new kidney polices are working as intended

Research in focus: examining organ offers
Three recent studies from UNOS researchers examine offer acceptance practices and impact of Offer Filters tool.
New milestone reached in kidney donation and transplant
For the first time, more than 25,000 kidney transplants were performed in a single year