in focus
Liver transplant volume in most states equivalent to or better than prior two years.

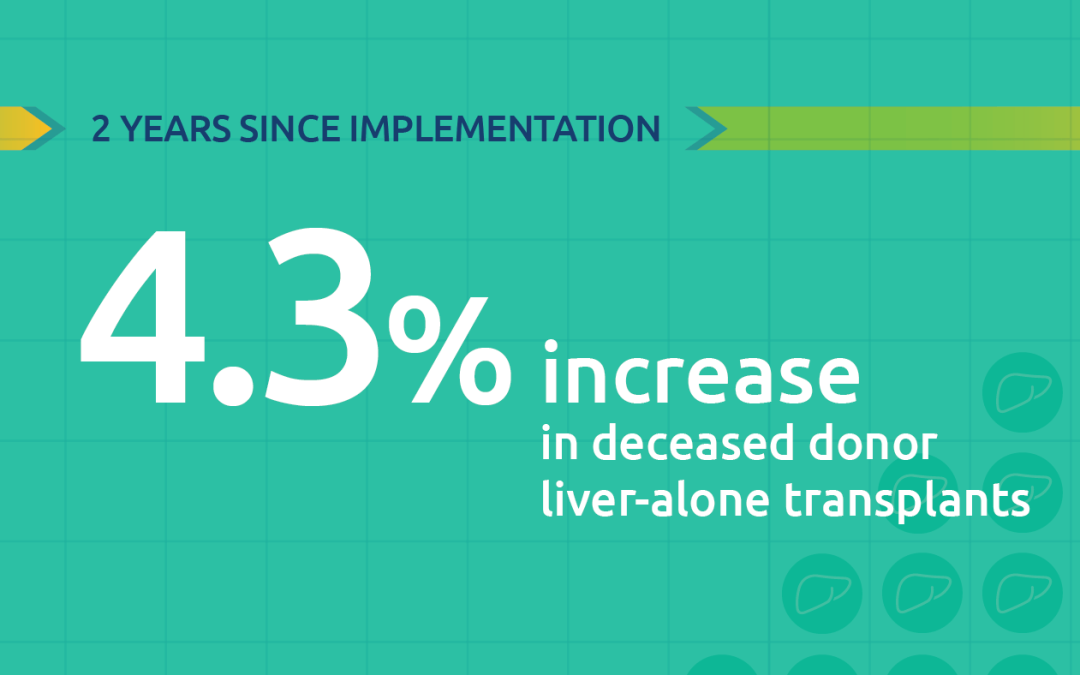
In the two years following the launch of the national liver allocation policy based on acuity circles, nearly 15,300 deceased donor liver-alone transplants were performed nationwide. This was an increase of 4.3 percent over the corresponding two-year period before implementation.
A key focus in monitoring the policy’s performance has been its effect on transplant volume in various geographic areas. At two years post-implementation, the policy has shown no significant change overall in the number of deceased donor transplants performed in the states where a liver transplant program is based.
The attached figure shows deceased donor liver transplant volume for each state with at least one liver transplant program, comparing 24-month eras before and after policy implementation. It indicates the following trends:
- Nearly half of the states (shown in green) experienced a net change in volume of no more than 10 percent, either positive or negative. (Keep in mind that percent change is relative to overall volume; states with a higher baseline transplant volume may be less likely to experience major percentage shifts.)
- Of the states where there was a volume difference of more than 10 percent, more experienced a substantial increase than a substantial decrease.
Proportion of states experiencing a given percent change in number of deceased donor liver-alone transplants pre- to post-acuity circles
A key focus in monitoring the policy’s performance has been its effect on transplant volume in various geographic areas.
Proportion of states
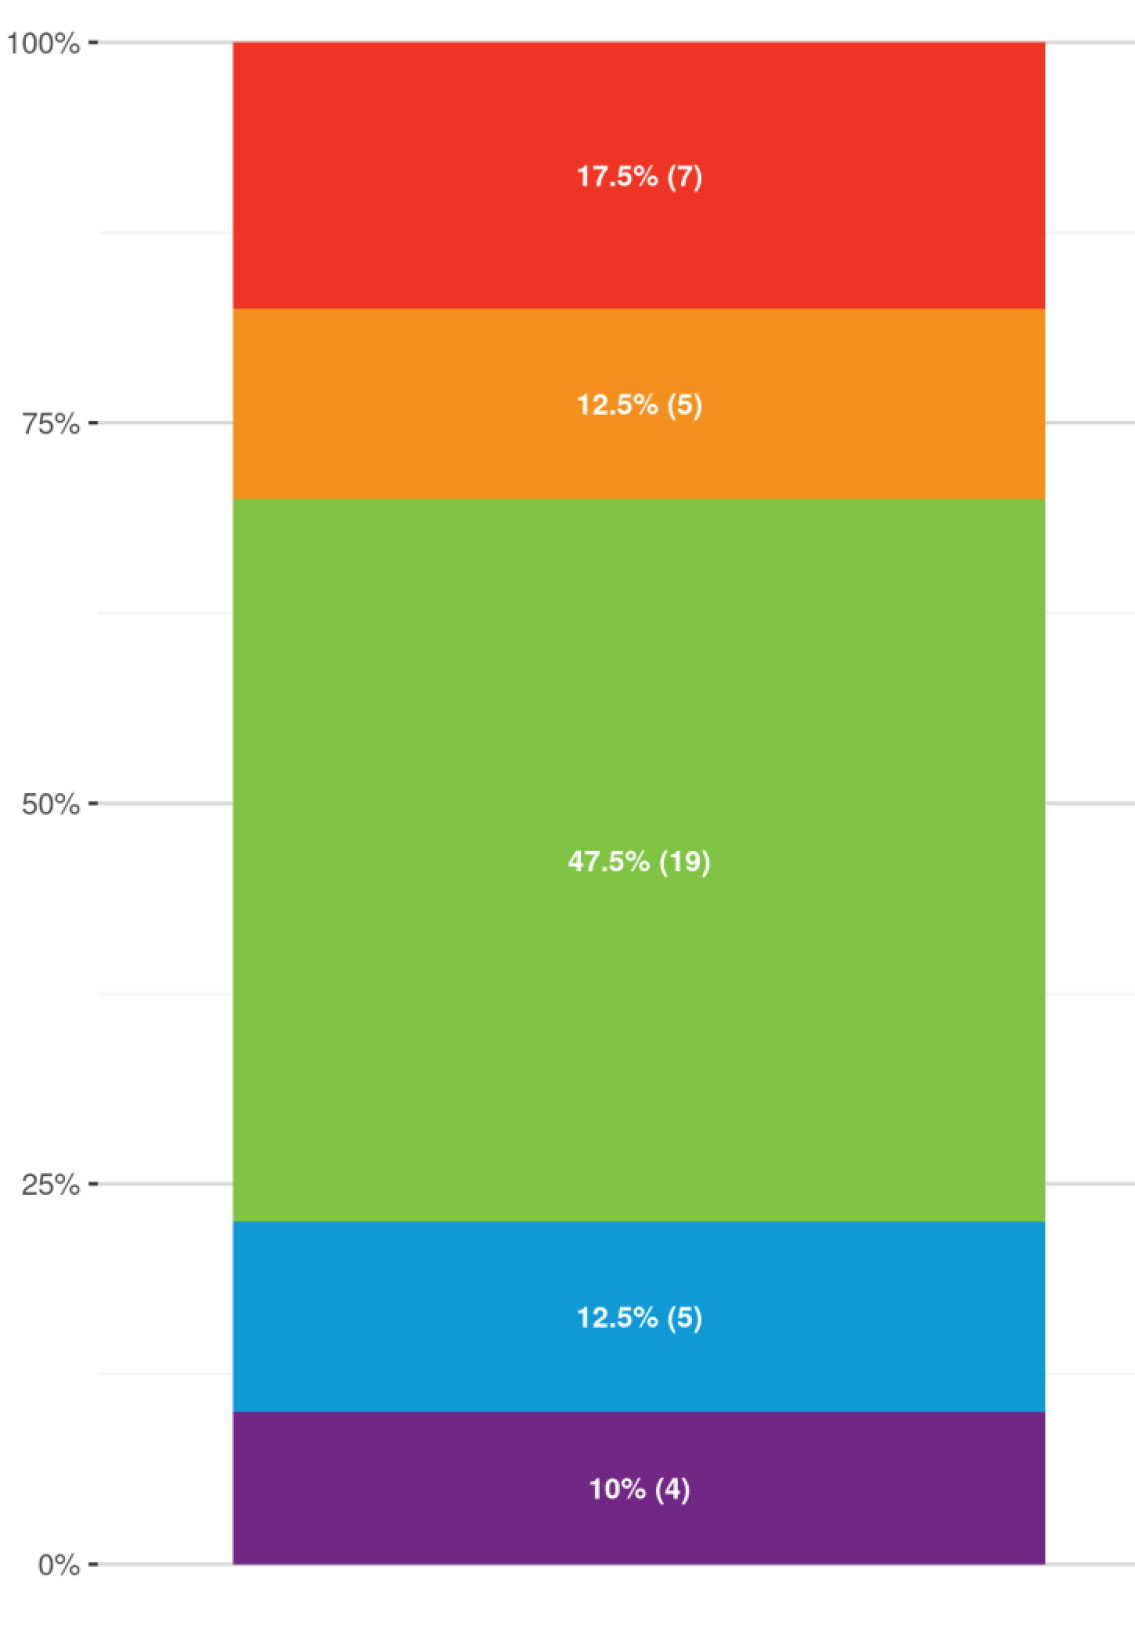
Percent change in number of deceased donor liver-alone transplants post- vs. pre-acuity circles
+20% or larger increase
+10% to +20% increase
increase or decrease no larger than 10%
-10% to -20% decrease
-20% or larger decrease
Only 40 states have transplant programs.
The specific comparison for each state is listed in Table 87 of the two-year monitoring report. The Kruskal-Wallis test indicated that there was not a statistically significant change pre- to post-policy in the number of deceased donor, liver-alone transplants performed in each state (x21=0.0514, p=0.821). In addition, Figure 24 of the two-year monitoring report displays a scatterplot by state comparing adult liver transplant volume before and after policy implementation.
Source: “Two Year Monitoring Report of Liver and Intestine Acuity Circle Allocation: Removal of DSA and Region as Units of Allocation,” data report presented to the OPTN Liver and Intestinal Organ Transplantation Committee August 5, 2022.
Note: Much of the post-transplant policy period has coincided with the national state of emergency declared March 13, 2020, due to the COVID-19 pandemic.
In focus
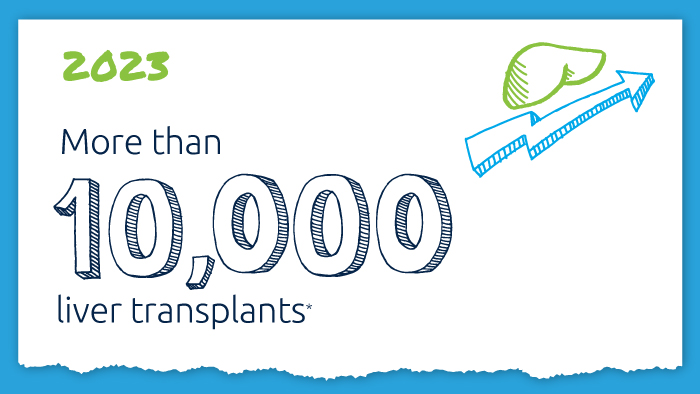
A decade of record increases in liver transplant
10,660 liver transplants, the most ever in a year.
Black kidney candidates are receiving waiting time modifications, helping them get the organs they need
Latest kidney monitoring report shows two new kidney polices are working as intended

Research in focus: examining organ offers
Three recent studies from UNOS researchers examine offer acceptance practices and impact of Offer Filters tool.
New milestone reached in kidney donation and transplant
For the first time, more than 25,000 kidney transplants were performed in a single year