in focus
Explore current and historic U.S. donation and transplant trends.
Updated weekly, new OPTN metrics dashboard provides comprehensive information about donation and transplant trends.
A new interactive data visualization accessible in the Data section of the Organ Procurement and Transplantation Network website provides a comprehensive source of OPTN information to the donation and transplant community. Professionals, patients and the public can see at a glance the metrics used to measure the success of the nation’s transplant system. “Sharing this kind of data fosters trust in the transplant community and show transparency,” says Read Urban, UNOS senior business intelligence analyst.
What dashboard users can expect
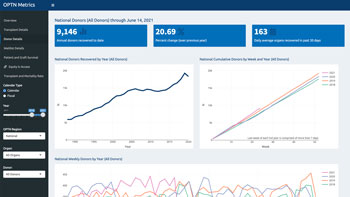
Dashboard users have access to a range of donation and transplant trends, including:
- Trends related to:
- Waitlist additions
- Transplants performed (both living and deceased donors)
- Donors recovered
- 1-year patient and graft survival trends
- Data related to equity in access to transplantation
- SRTR transplant and waitlist mortality rates
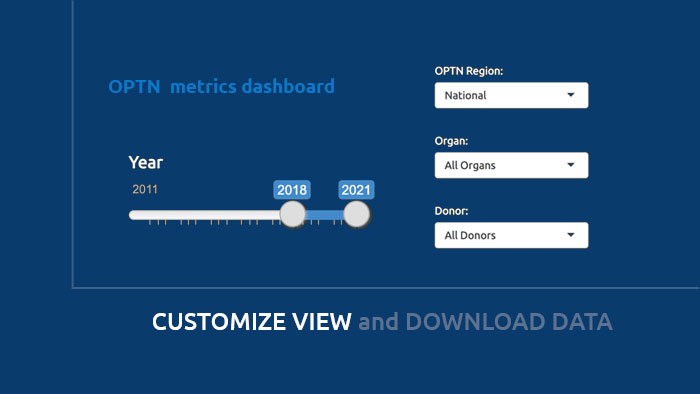
Data can be filtered by OPTN region, organ type and donor type. Trends in waitlist additions, transplantation and donation are updated weekly, with other metrics updated when they become available. Users are also able to see transplants and donors recovered and waitlist registrations by state in the past 12 months (these data are updated monthly).
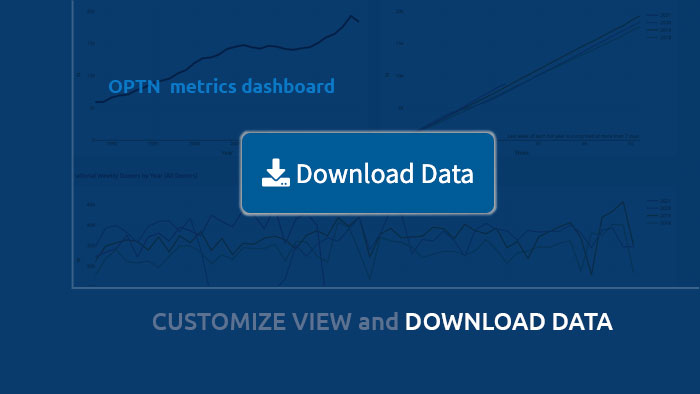
Users are able to download data from the dashboard, and a user guide provides detailed documentation about all the data presented and how it is organized.
The UNOS business and data products team works to provide a comprehensive source of OPTN information to the community. The goals for this project are to offer the community transparency into the metrics used to measure the success of the OPTN, and also to allow users to investigate current and historic trends in transplantation. Please contact the team directly at [email protected] with any questions or feedback.
The U.S. has the highest-performing organ donation and transplant system in the world, and set a record for the most lives saved by deceased donor organs in 2020. Read more.
OPTN metrics dashboard
Explore current and historic U.S. donation and transplant trends at national and regional levels.
Data visualizations for:
- donors
- transplants
- patient and graft survival
- changes across time
The OPTN strategic plan prioritizes increasing the number of transplants and improving transplant recipient outcomes.
Equity in access to transplant dashboard
UNOS researchers discuss how the OPTN tracks equity through Access to Transplant Score.
In focus
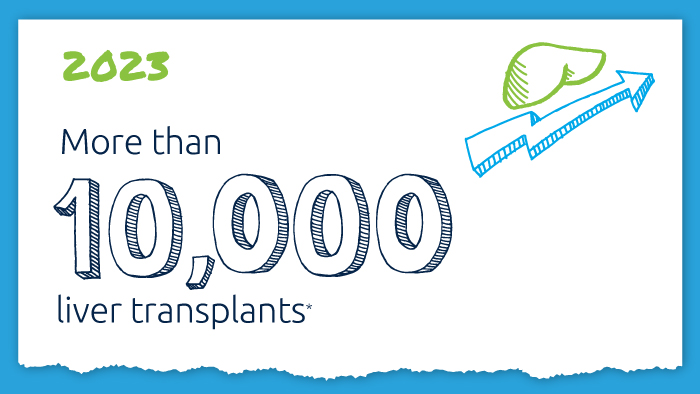
A decade of record increases in liver transplant
10,660 liver transplants, the most ever in a year.
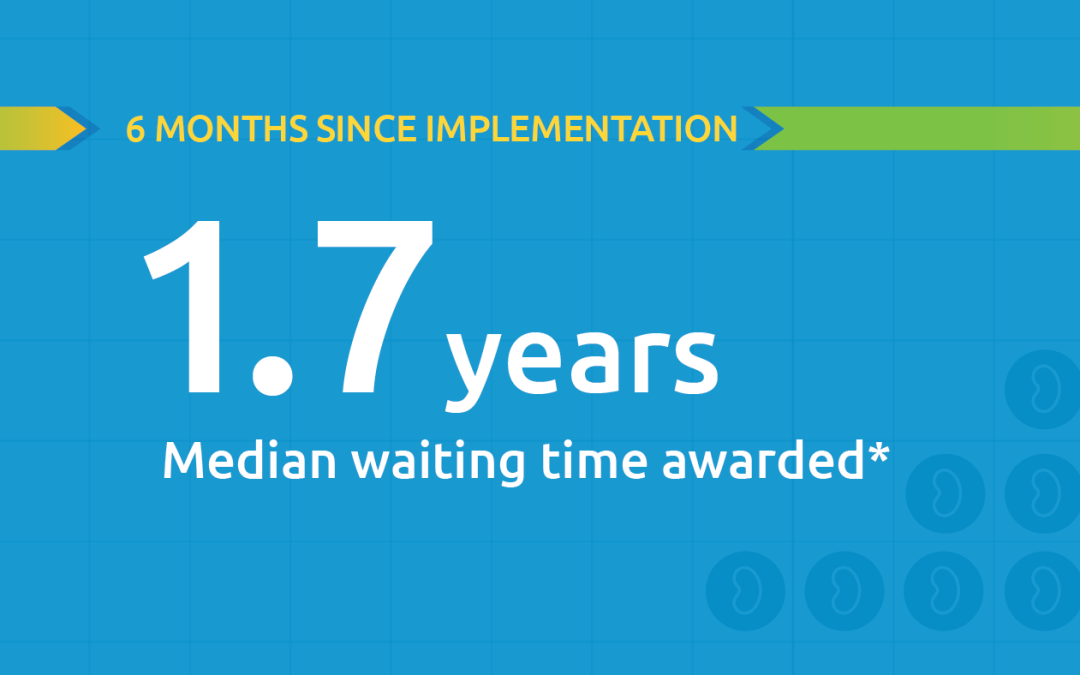
Black kidney candidates are receiving waiting time modifications, helping them get the organs they need
Latest kidney monitoring report shows two new kidney polices are working as intended

Research in focus: examining organ offers
Three recent studies from UNOS researchers examine offer acceptance practices and impact of Offer Filters tool.
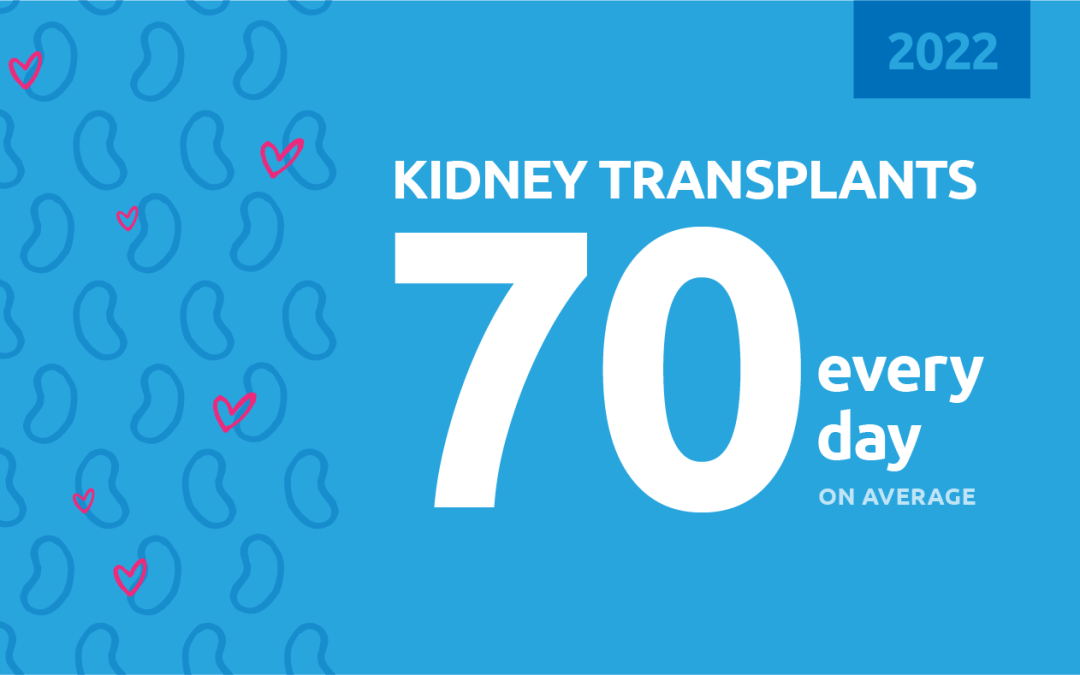
New milestone reached in kidney donation and transplant
For the first time, more than 25,000 kidney transplants were performed in a single year